
Austin Housing Market Report September 2026


Staying informed about the Austin housing market is crucial, whether you're looking to buysell. See what’s happening in the Austin housing market and how broader economic trends and local activity are creating a more balanced and confident real estate environment.
While national real estate conditions continue to shift, the Austin real estate market is transitioning into its fall rhythm. September brought a natural moderation in buyer activity combined with ample inventory across the metro area, giving buyers room to evaluate their options and negotiate comfortably. Rather than feeling rushed and entering into bidding wars, today’s buyers and sellers are taking a thoughtful approach—balancing local price trends and broader affordability factors as we move into the fourth quarter.
Let's look at September’s numbers:
-
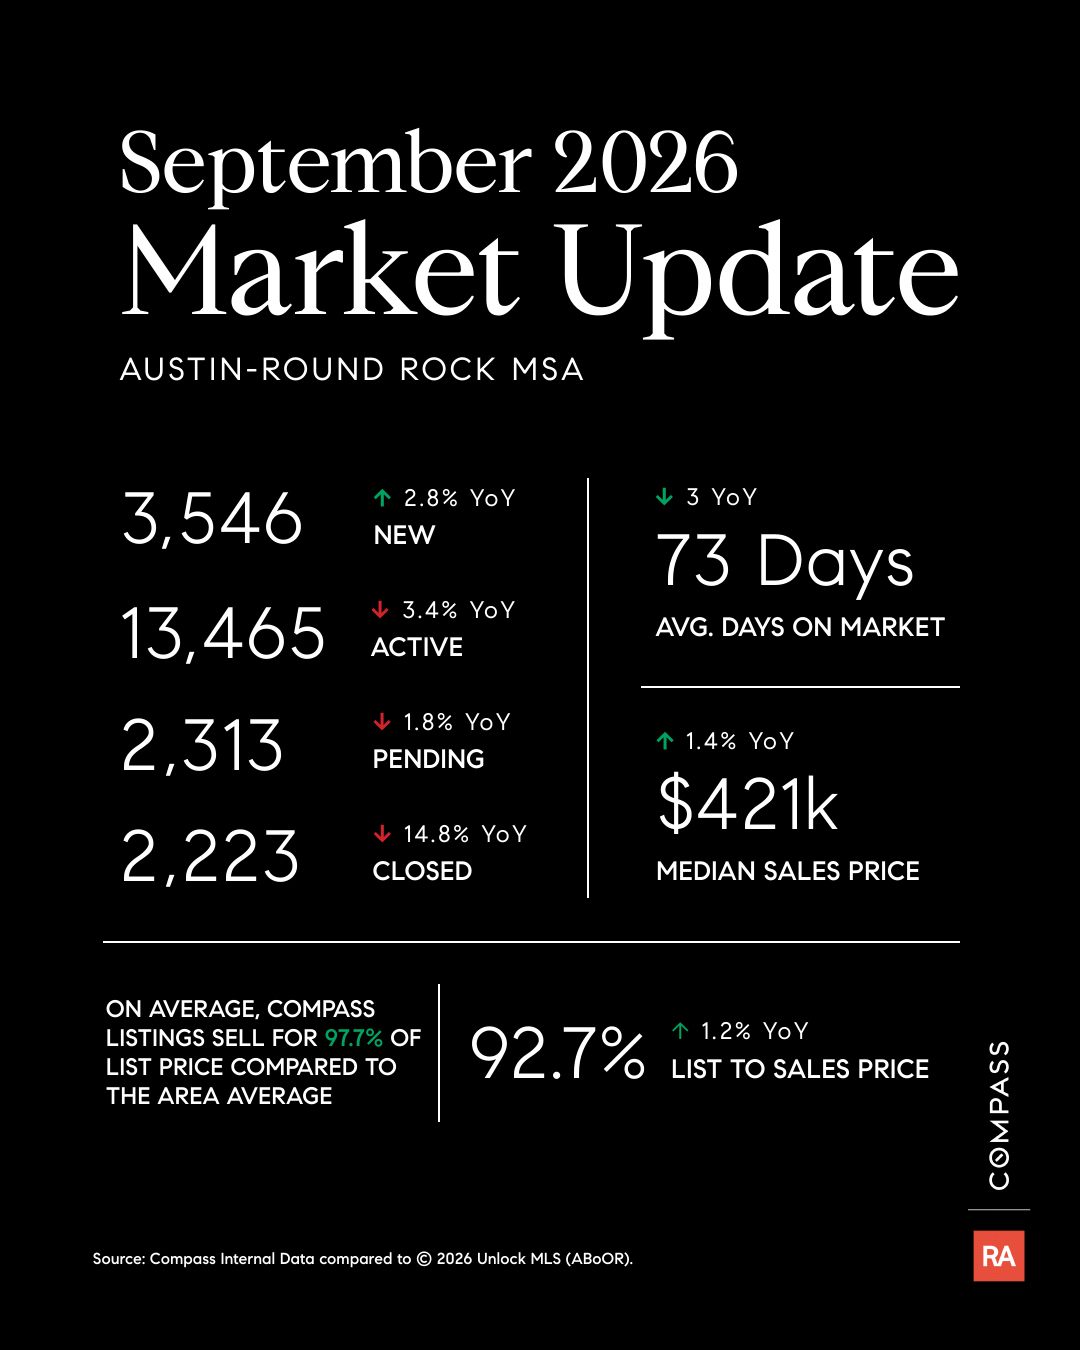
Active Listings — September ended with 13,465 active listings, marking a 3.4% decrease from last year and a 1.5% decrease from August.
-
Home Prices — The median home price was $421K, increasing 1.4% year over year and 2.2% month over month.
-
Days on Market — Homes spent an average of 73 days on the market, down 3 days from the year before and up 7 days from August.
-
Pending Sales — Pending sales totaled 2,313, down 1.8% from last year and 11.8% from last month.
-
Closed Sales — September saw 2,223 closed sales, a decrease of 14.8% from last year and 11.1% from August.
-
Housing Inventory — Housing supply stood at 5.4 months, 0.1 months lower than a year ago and 0.3 months higher than in August.
-
Market Snapshot — Over 10,000 homes are on the market, selling for an average of 92.7% of the original list price; Compass listings achieved an average of 97.7% of their original list price and sold 15 days faster than the MLS average.
Source: Austin Board of REALTORS®, Austin-Round Rock-San Marcos Metropolitan Statistical Area.
Affordability Goes Beyond the Asking Price
Austin’s median home price reached $421,000 in September, up 1.4% from a year earlier and 2.2% from August. Still, for prospective buyers, the purchase price is only the starting point in determining what they can comfortably afford. Even when buyers find a home within their target price range, insurance, property taxes, and other ongoing expenses continue to stretch household budgets nationally. Higher borrowing costs can also complicate a move for existing homeowners, as those who locked in lower mortgage rates may be reluctant to sell and give them up.
It’s worth noting that Austin offers an encouraging example within a challenging national affordability picture. In its analysis of the new 21st Century ROAD to Housing Act, The Pew Charitable Trusts highlights Austin’s local housing reforms as an example of progress toward easing housing costs.
On the ground, pricing flexibility may help ease some of the affordability pressures local buyers face. In September, homes sold for an average of 92.7% of their original list price. While that figure reflects both listing price reductions and negotiations, it reinforces the importance of competitive pricing for sellers and carefully researched offers for buyers.
Inventory Remains Ample as Listings Edge Lower
September ended with 13,465 active listings, down 3.4% year over year and 1.5% from last month. Meanwhile, housing supply increased to 5.4 months, up from 5.1 months in August. Together, these signals suggest that while the number of homes on the market has edged lower, a supply buffer continues to give buyers room to negotiate and compare options as we enter the fourth quarter. A well-prepared listing and realistic, data-backed pricing can help position a home for buyers who remain active this fall.
A Slower Fall Market Calls for Flexible Timelines
Homes in the Austin metro spent an average of 73 days on the market in September—a week longer than in August. Contract activity also eased, with 2,313 pending sales, down 11.8% from the last month. The annual comparison offers some perspective, however. Pending sales were down 11.8% from August—reflecting a challenge also seen nationwide—but just 1.8% from last September, while homes spent three fewer days on the market. Closed sales showed a sharper slowdown, totaling 2,223 closed sales—down 14.8% annually and 11.1% from August. While a moderation in pace is expected following previous years’ activity, September may have felt slightly more sluggish than expected.
Together, these figures reflect a market entering a quieter fall season, further shaped by ongoing affordability pressures. For sellers hoping to move before the holidays or coordinate a sale with their next purchase, it’s important to build flexibility into their plans.
Local Conditions Shape the Market Experience
September’s metro-wide figures tell only part of the story. In Travis County, the median price rose 2.6% year-over-year to $497,400, while Williamson County’s median declined 2.5% to $395,000. Available supply also varied considerably, from 4.8 months in Hays County to 7.6 months in Bastrop County.
These differences suggest that while the metro-wide figures provide a good starting point, recent sales and competing listings in the same neighborhood offer a more useful guide to timing and pricing.
Prepare for Your Next Move
Whether you are navigating shifting market conditions, timing a holiday move, or seeking guidance on your local market, having expert guidance can help you plan your next step. To ensure you’re all set up for success, connect with a Compass agent today for personalized advice and a strategy tailored to your situation.
For the latest market updates, follow us on social media @realtyaustincompass. Subscribe to our market newsletter by clicking "sign up" in the top right corner of our website.
Enjoy this blog post? Click here to subscribe for updates
Leave A Comment